

Ask an assistant what a two-bedroom flat rents for in a given city, and watch what it does. It goes looking for a source that states a number — with a date on it, ideally with the sample size behind it. It does not want your listings. It wants your median.
I run a small portfolio of real-estate and classifieds sites. They were sitting on thousands of prices and publishing none of them as data. This is what it took to close that gap, and what it actually changed — the setup, the plumbing that makes a figure quotable, and the monthly routine that keeps it honest.
How I got here
I had spent months on the editorial side of AI-era SEO, and I had done it properly: structured data on every listing, FAQ markup, an llms.txt, neighbourhood guides, enriched archive pages. It worked. And working is exactly what exposed the problem.
Everything I had built, anyone can rebuild. Markup is copied in an afternoon. A guide is rewritten by someone with more time than me. None of it is a position; all of it is table stakes.
Two things pushed me over the edge in the same week.
The first: my sites displayed prices on every single page and no page said what the price was. Thousands of amounts, typed in by hand by people with no reason to be consistent, and not one aggregate anywhere.
The second was worse, because it was my own doing. Several of my articles already published price tables — hand-typed, frozen at the moment of writing, one of them computed over five properties. All still online. All still confidently phrased. All by then diverging from the live data, silently.
So the decision was not “let’s add a stats page”. It was a change of ownership: the dataset becomes the source of truth, articles keep the analysis a human writes well, and anything numeric points at the dataset.
The one asset a competitor cannot copy
A classifieds site’s only defensible asset is its corpus — not its templates, not its markup, not its editorial calendar. The corpus has a property none of those have: it accumulated over years and cannot be back-dated.
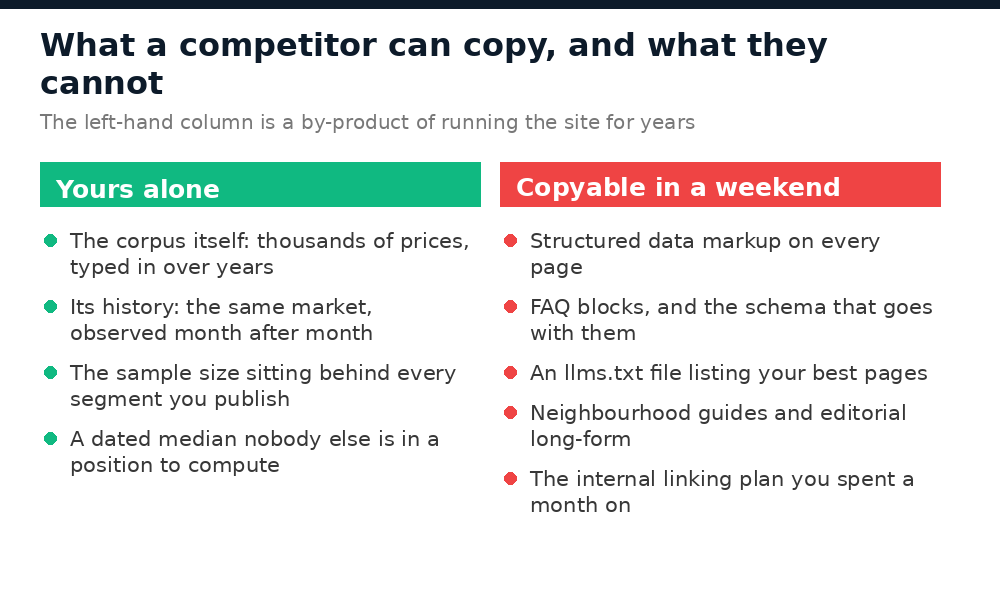
Publishing an aggregate turns a pile of pages into a source. That is the whole thesis, and everything below is the mechanics of making it stick.
What actually gets cited
A number on a page is not a citable number. The gap between the two is a short, boring list — and every item on it is one someone can check you on.
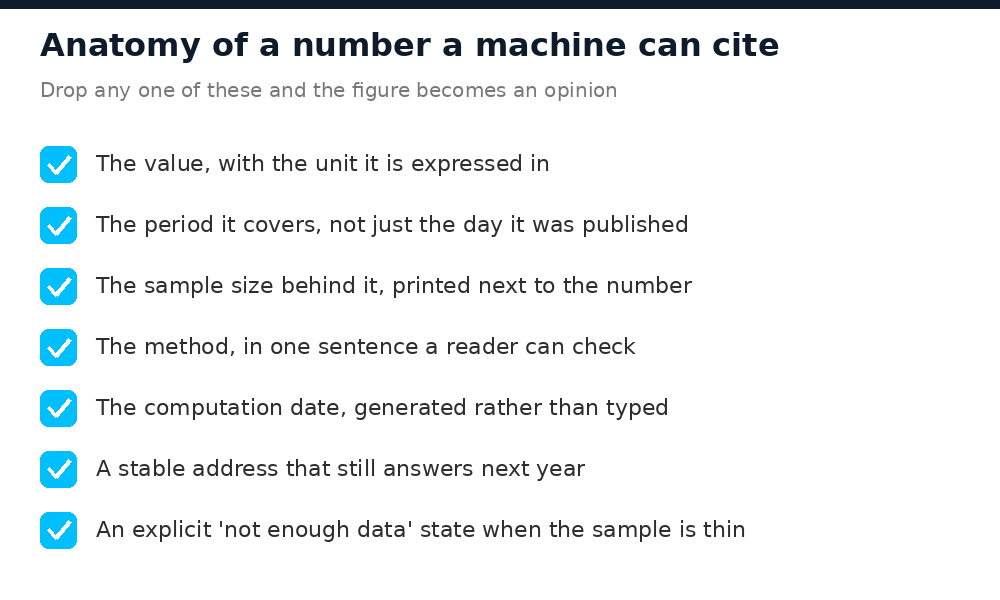
The one people skip is the sample size. A figure published without its n is an opinion in numeric clothing, and it is indistinguishable, to a reader and to a machine, from one computed on four rows.
Medians rather than averages, for a reason worth one sentence: listing prices have a long right tail, so an average lands somewhere no real transaction lives, while the median answers the question people actually asked. Quartiles go next to it so the spread stays visible.
The dataset, in one section
The engine itself deserves its own article — this one is about what you do with its output — but you cannot publish figures you have not earned, so here is the short version.
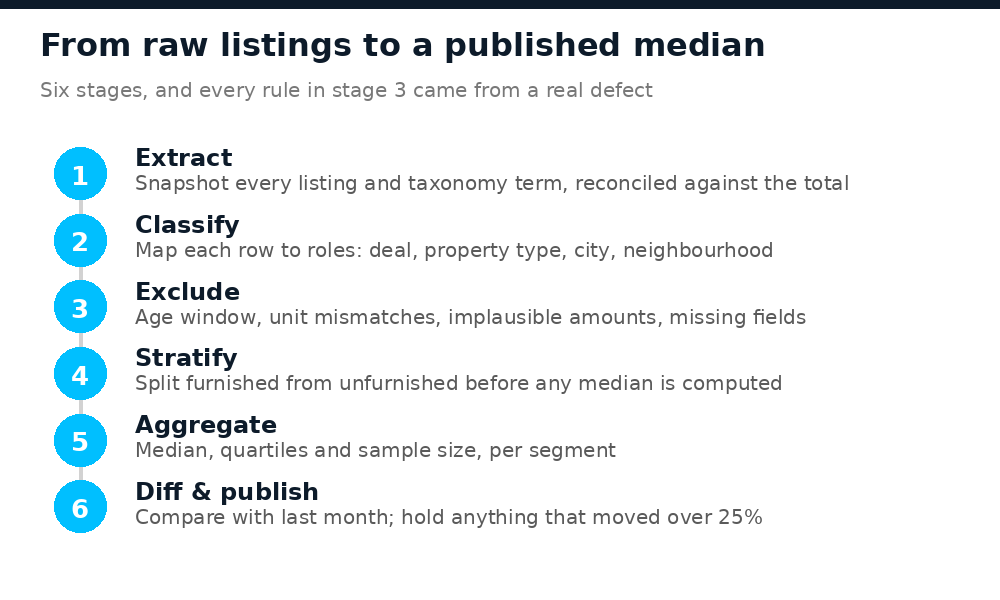
Two design choices carried the rest. The engine never reasons about field names, only about roles — deal, property type, city, neighbourhood — with a per-product schema mapping each role onto whatever that product happens to call it; connecting a second, differently structured source needed a schema entry and no engine code. And every exclusion rule is explicit and counted: an age window, unit normalisation for rents quoted per night or per week, plausibility bands per currency, a minimum sample of five listings per segment and eight at the finest geographic level.
The result is uncomfortable and correct: 1,902 listings in the raw corpus, 881 in the published dataset. That gap is not data cleaning, it is a series of refusals, each one added after a number came out visibly wrong.
One warning before you publish any trend from an aggregate: check the mix. My first reconstructed series showed rents down more than 40% over three years. Splitting the same listings into furnished and unfurnished showed both strata flat — only their proportions had moved. Nothing had got cheaper; the cheap category had become the majority. Stratify before you publish a direction, or you will publish a composition effect and call it a market.
Refusing to publish is what earns the citation
The most valuable feature I built is a refusal.
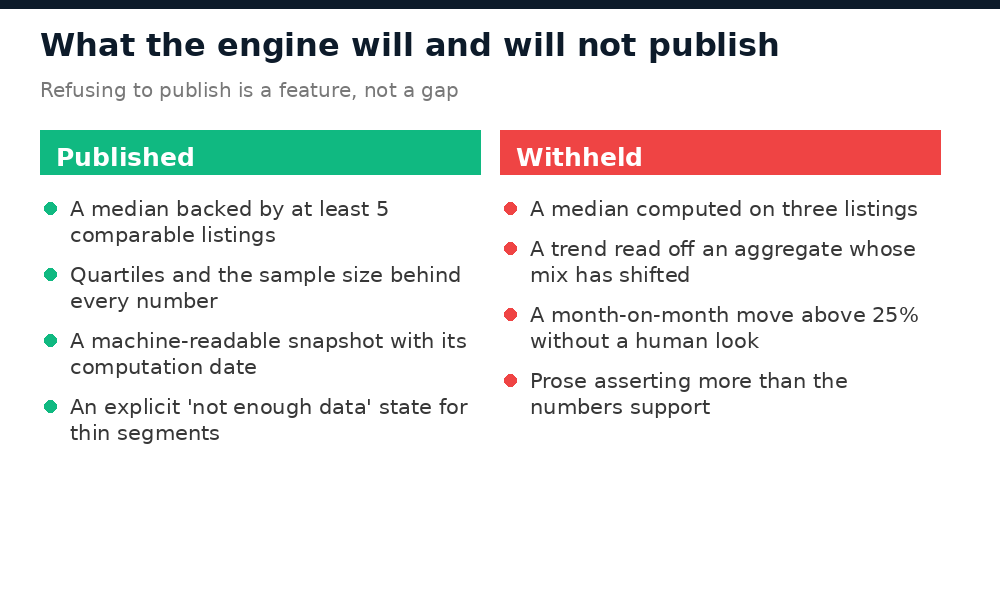
Segments below the sample threshold are computed, kept in the internal report, and not published. Thin ones get an explicit “insufficient data” state instead of a median over five rows. Retained listings are counted separately from excluded ones, so the published sample size is the real one and never quietly inherits the corpus total.
The reasoning is not moral, it is arithmetic on trust: a number that is not robust costs more in credibility than it earns in coverage. One reader who checks a figure against reality and finds it absurd will not check the next one — and neither, at scale, will a system that learned your pages are unreliable.
Machine-readable, not just visible
This is the cheapest step and the one most often skipped. The same figure has to exist in several forms at once.
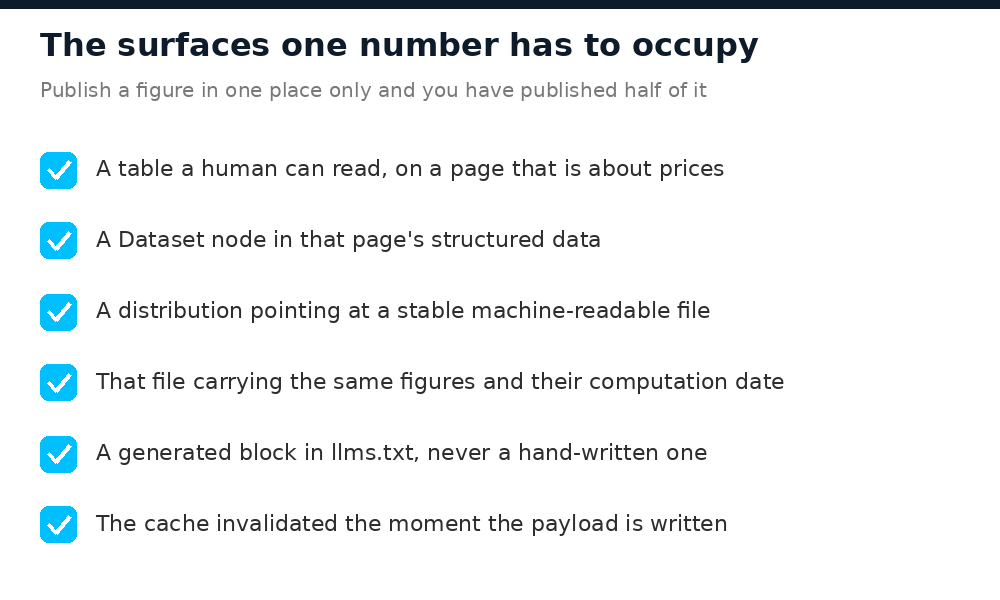
Concretely: the page carries a Dataset node in its structured data, and that node’s distribution points at a stable JSON endpoint serving the same figures plus their computation date. A reader gets a table; a machine gets a file it can quote with a date attached.
The llms.txt gets a market-data section too — and, importantly, that section is generated from the payload rather than written. The curated part of the file, which contains no figures, stays hand-written. Splitting that file along “does this sentence contain a number?” turned out to be a far better boundary than splitting it by topic.
Which is the rule that ended up organising the whole project: if a piece of text contains a figure or a date, it is not written by hand. A hand-written “figures as of March” keeps saying March after the next recomputation. A human might notice. An assistant will quote it with the authority of a source that declares itself current, which is worse than having published nothing at all.
The same rule caught a subtler bug: the endpoint’s cache has to be invalidated at the moment the payload is written. Without that, the file most likely to be read by a machine served last month’s figures for hours after the page had updated — the page and its machine-readable twin disagreeing is precisely the failure the design exists to prevent. The mechanics of the markup side are in making WordPress content AI-ready; what I want to stress here is that the data behind it has to move on its own.
Internal links that carry a figure
Here is the part that humbled me. The pillar page went live — correct, complete, structured, machine-readable — and connected to nothing. A sweep of 186 published articles found zero inbound links to it.
A pillar page with no inbound links is discovered by the sitemap and by nobody else. It inherits no weight from the rest of the site, and every other surface I had built was working for an audience of one. Building the thing and connecting the thing are two projects, and I had budgeted for one.
Connecting it taught me more about internal linking than years of reading about it:
- A link has to carry information. Each linking paragraph states the figure relevant to its own subject — the neighbourhood median in a neighbourhood guide, the city-wide figure in a city-wide piece. The same generic sentence repeated across 28 articles is link spam; 28 sentences each carrying a different datum is internal linking. One of them earns the click, and only one of them survives a human reading it.
- Address targets by ID, never by slug. My first pass listed slugs written from memory. Two did not exist, and those articles were silently skipped — a wrong slug raises no error, it simply never matches. Silent no-ops are the worst class of bug in content automation, because the report looks like a success.
- The effect cascades. Locality archive pages — the highest-intent URLs on the site, and previously the thinnest — now carry price context drawn from the same payload. Articles stopped freezing their own tables and started pointing at the source.
The monthly routine
None of the above stays true on its own. What keeps it true is a routine that is boring on purpose.
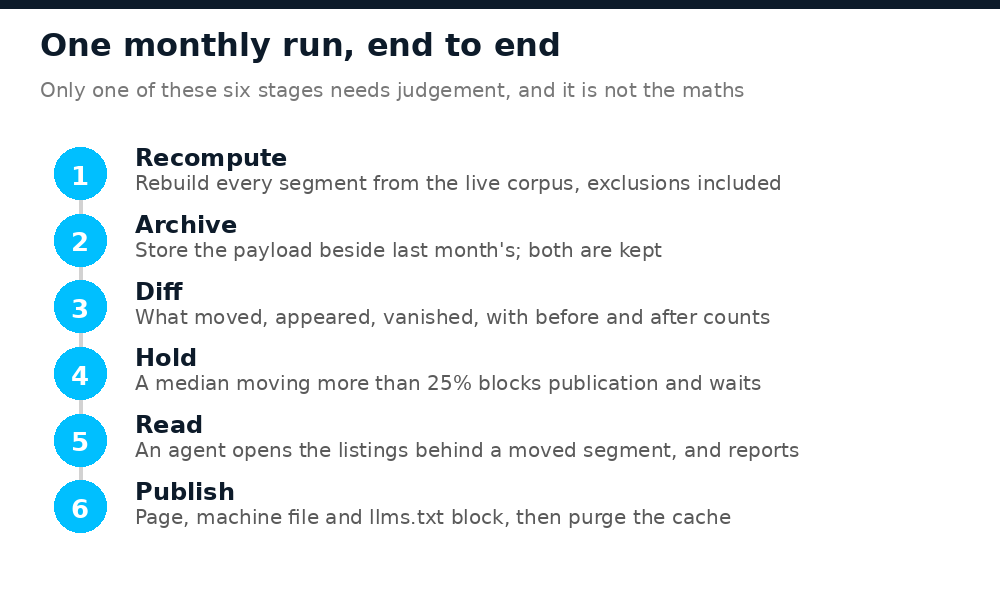
Monthly, not weekly. I started weekly. A weekly refresh mostly published noise — moves that were sampling, not market — and trained me to ignore its own output, which is the one outcome that makes the whole apparatus worthless. Monthly is what the underlying data can support.
A timer, not a cron job. The scheduler is a user-level systemd timer, for exactly one property: Persistent=true catches a missed run. A machine that was switched off at the scheduled hour is the normal case, not the exception, and cron skips it in silence.
The diff is the actual product. Each run is archived next to the previous one and compared against it: what moved, what appeared, what vanished, each carrying its before and after sample size. A median that moved on a sample going from 5 to 30 is a completely different event from one that moved on a stable sample, and only the counts make that visible. Beyond 25% of month-on-month drift, publication stops and waits for a human. Not because such a move is impossible, but because at that magnitude the explanation is rarely the market alone — it is usually a batch of listings that arrived, a labelling change, or a bug I shipped.
Then something has to read. This is why the refresh is not a fully scheduled job. The very first computation produced a neighbourhood median that was arithmetically correct and factually false: three plots from a distant satellite area had been filed under a central neighbourhood, and on a sample of five they dragged the median somewhere no property there has ever traded. No script distinguishes a market movement from a cluster of mislabelled rows. So the run hands the moved segments to an agent, which pulls the actual listings behind them through a typed interface to the site — my own MCP server — and reports what it finds: a batch import, a re-tagged area, a genuine shift. A human arbitrates on that summary, and publication is gated on the arbitration.
The rule written at the top of that workflow is the one I would keep if I kept nothing else: a change in a median is a question, not an answer. Never conclude on a gap without having read the listings behind it. Which gives the honest description of the AI layer here — it adds no computation whatsoever; it adds the review. That is the same boundary I described in agentic content pipelines: deterministic gates, bounded agent judgement, here applied to a statistical workload instead of an editorial one. The engine stays schema-driven for the same reason it started that way — see building schema-driven MCP servers — so a second site joins the routine with a schema entry rather than a fork.
And a run touches far more than a page. “Refresh the dataset” sounds like it updates one URL. It does not.
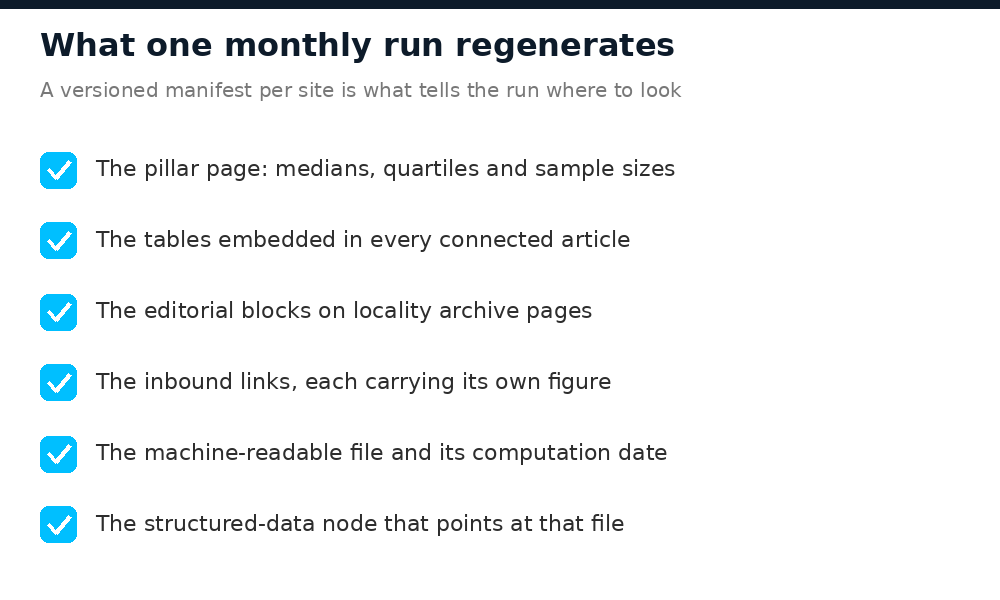
Knowing which surfaces to regenerate is its own problem, and I got it wrong first: an early version rebuilt one kind of surface and left roughly half the connected pages to drift, with nothing failing, because nothing was checking. The fix is a small versioned manifest per site — one line per connected surface, each typed by kind, rebuilt from the live site rather than from the repository. It is the least clever file in the project and probably the one that saves me the most.
What it changed, and what I cannot claim
The concrete outcomes are easy to state. The highest-intent pages on the site stopped being empty of context. Seven of my own articles carried hard-coded tables computed over the entire corpus with no age limit; all seven were rewritten against the dataset and their tables now regenerate with it. A page nobody linked to now has twenty-eight paths into it, each of them carrying a figure rather than an anchor.
The deeper one: the dataset did not create the errors in my old content — it made them detectable. They had been live for months, plausible, confidently phrased and completely unfalsifiable, because there was nothing to check them against.
Now the part an SEO post usually leaves out. I cannot show you that this produced citations. AI assistants do not, in general, tell you when they used you, and the server-side crawler logs I would need to say anything serious about it are not available to me yet. Anyone selling you attribution numbers for AI answers today is ahead of the evidence.
What I can say is that the preconditions are now met, and they are the part under my control: a figure that is dated, sourced, bounded by its sample size, addressable at a stable URL, available in a form a machine can parse, and regenerated on a schedule that keeps all of that true. If it turns out that none of this matters, I still own a dataset that made my own past writing checkable. That alone paid for it.
Frequently asked questions
Does publishing a dataset actually get you cited by AI assistants?
Honestly: nobody can prove it to you right now, and I am not going to pretend otherwise. Attribution for AI answers is mostly unavailable, and the crawler-level evidence is hard to get. What is verifiable is the other side of the exchange — a dated figure with its sample size, at a stable machine-readable address, is quotable, and an undated table hard-typed inside a blog post is not. I optimised for the part that is under my control.
Why a median rather than an average?
Listing prices have a long right tail; a handful of exceptional properties drag an average somewhere no real transaction lives. The median answers “what is a normal price here?”, which is the question people actually have. Publish quartiles alongside it so the spread stays visible.
My corpus is small. Is this worth doing?
The machinery works at any size; the publishing threshold is what protects you. On a thin corpus most segments never clear the minimum, and the honest output is a coverage state rather than a price. “We do not have enough data here yet” is information, and it is far better than a confident median over four listings. What you can safely skip early is the automation — the manifest, the timer, the regeneration. Compute by hand until the figures are worth trusting, then automate the part that keeps them trustworthy.
Isn’t llms.txt speculative?
Yes. It is not a standard, and it may go nowhere. It is also generated rather than hand-written, which makes its ongoing cost roughly zero — and that asymmetry is the entire argument. Bet on cheap generated surfaces; do not hand-maintain a file for a convention that has not settled.
Why involve an agent rather than a scheduled job?
Because the hard step is not computing the diff, it is deciding what a moved median means, and that requires reading the listings behind it. Computation, archiving and diffing are deterministic code. The reading is delegated, bounded by an explicit rule — never conclude on a gap without opening the segment — and the publish decision stays human. The agent adds no arithmetic; it adds the review that would otherwise never happen.
What would you build first if you started over?
The month-on-month diff. It is maybe forty lines and it is the only component that tells you your own pipeline broke. Everything else tells you about the market.